Explaining Website Reliability by Visualizing Hyperlink Connectivity


 Chau.webp)
Abstract
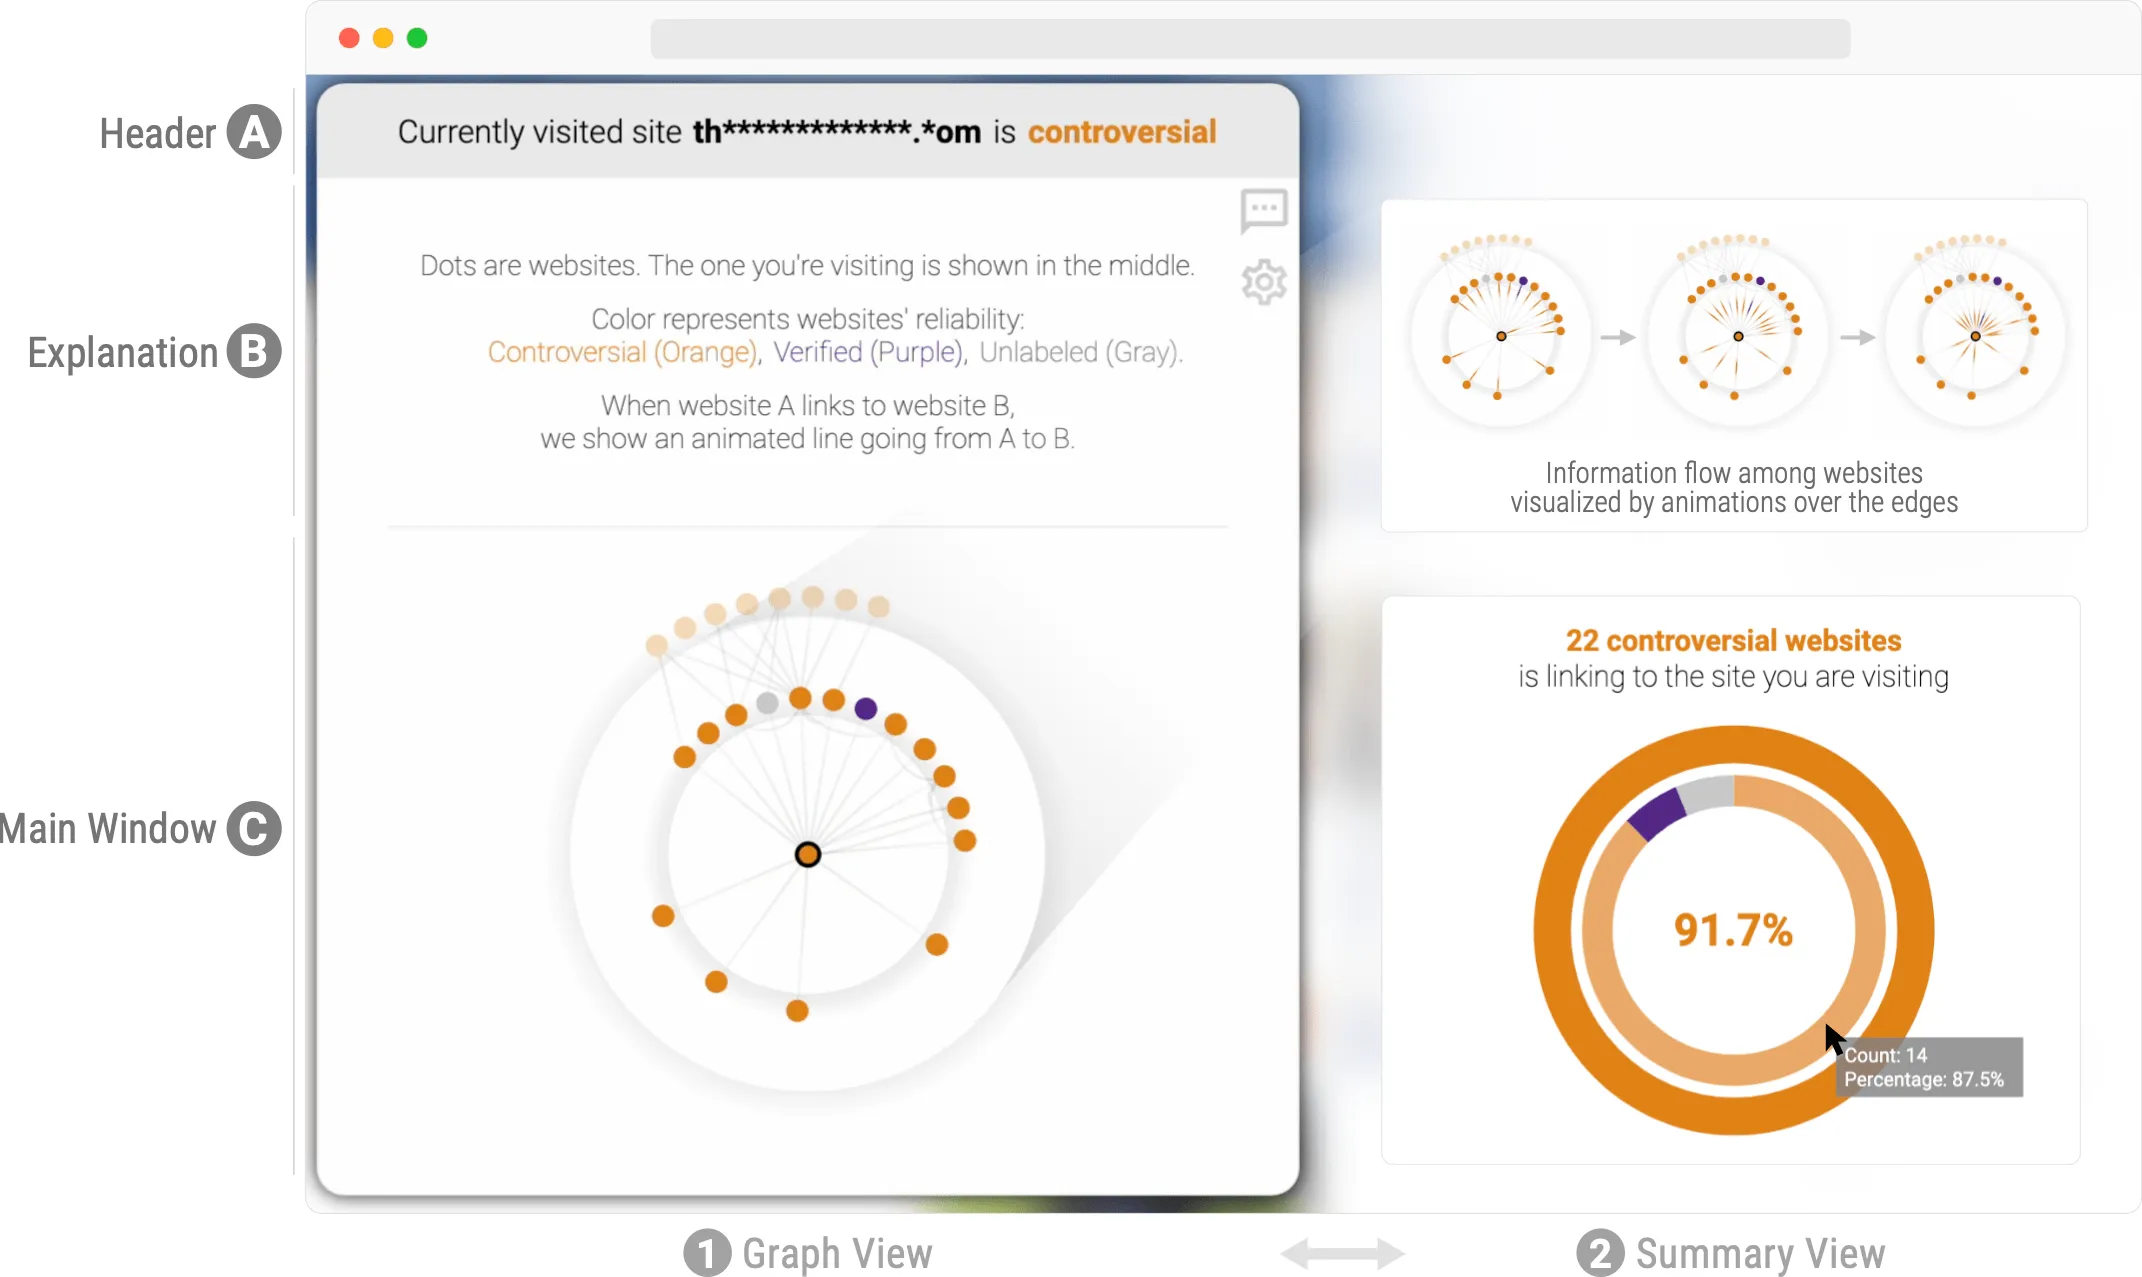
As the information on the Internet continues growing exponentially, understanding and assessing the reliability of a website is becoming increasingly important. Misinformation has far-ranging repercussions, from sowing mistrust in media to undermining democratic elections. While some research investigates how to alert people to misinformation on the web, much less research has been conducted on explaining how websites engage in spreading false information. To fill the research gap, we present MisVis, a web-based interactive visualization tool that helps users assess a website’s reliability by understanding how it engages in spreading false information on the World Wide Web. MisVis visualizes the hyperlink connectivity of the website and summarizes key characteristics of the Twitter accounts that mention the site. A large-scale user study with 139 participants demonstrates that MisVis facilitates users to assess and understand false information on the web and node-link diagrams can be used to communicate with non-experts. MisVis is available at the public demo link: https://poloclub.github.io/MisVis.
Citation
Explaining Website Reliability by Visualizing Hyperlink Connectivity
@article{leeExplainingWebsiteReliability2022,
  title = {Explaining {{Website Reliability}} by {{Visualizing Hyperlink Connectivity}}},
  author = {Lee, Seongmin and Afroz, Sadia and Park, Haekyu and Wang, Zijie J and Shaikh, Omar and Sehgal, Vibhor and Peshin, Ankit and Horng, Duen},
  year = {2022},
  journal = {2022 IEEE Visualization Conference (VIS)},
  langid = {english}
}