VisCUIT: Visual Auditor for Bias in CNN Image Classifier

crown jewel figure
VisCUIT reveals how and why a CNN image classifier is biased. Our user Jane trains a classifier using the biased CelebA dataset, which has high co-occurrence of the attribute black hair and the label smiling, to observe how the training data affects model predictions. She hypothesizes that the model would use the attribute black hair to predict smiling and launches VisCUIT to verify her hypothesis. (A) Subgroup Panel displays underperforming data subgroups found by UDIS. Jane figures out that several underperforming subgroups consist of people with black hair. To see whether the model indeed uses the attribute black hair for predictions, Jane clicks on subgroup #14, and VisCUIT displays subgroup #380, which is similar to #14 in terms of the last-layer feature vectors from the model but has high accuracy. Clicking on an image in each of those subgroups brings up a Grad-CAM Window, which shows that the classifier attends to (A1) forehead (near hair, irrelevant to smiling) for the subgroup #14 and (A2) mouth (relevant to smiling) for the subgroup #380. (A3) Confusion matrices quantitatively summarize such misclassifications that many not smiling black-haired people are wrongly classified as smiling. Jane is now certain that the classifier uses the attribute black hair for predicting smiling and therefore often misclassifies black-haired people. (B) The Neuron Activation Panel enables users to understand which neurons and concepts are responsible for misclassifications, by organizing the neurons in the model into 3 columns: the left column for the neurons highly activated only by underperforming subgroup, the right only by well-performing subgroup, and the middle by both. Clicking on a neuron displays a Neuron Concept Window, which reveals that (B1, B2) the subgroups #14 and #380 activate the neurons for the area near forehead and mouth, respectively.
Demo Video
Abstract
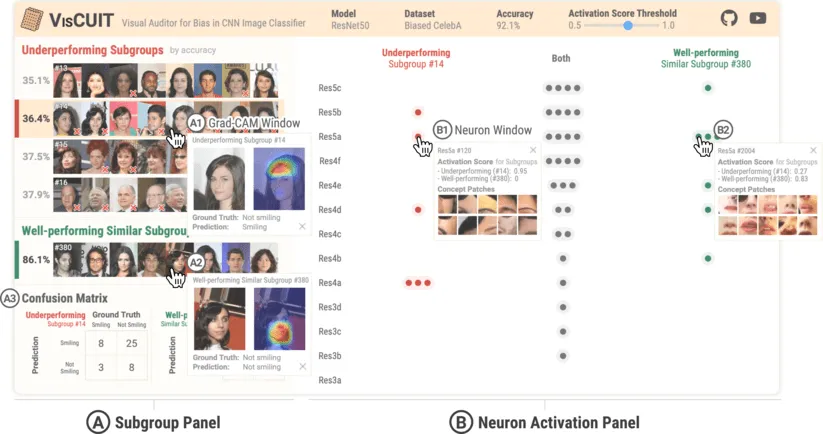
CNN image classifiers are widely used, thanks to their efficiency and accuracy. However, they can suffer from biases that impede their practical applications. Most existing bias investigation techniques are either inapplicable to general image classification tasks or require significant user efforts in perusing all data subgroups to manually specify which data attributes to inspect. We present VisCUIT, an interactive visualization system that reveals how and why a CNN classifier is biased. VisCUIT visually summarizes the subgroups on which the classifier underperforms and helps users discover and characterize the cause of the underperformances by revealing image concepts responsible for activating neurons that contribute to misclassifications. VisCUIT runs in modern browsers and is open-source, allowing people to easily access and extend the tool to other model architectures and datasets. VisCUIT is available at the following public demo link: https://poloclub.github.io/VisCUIT. A video demo is available at https://youtu.be/eNDbSyM4R_4.
Citation
VisCUIT: Visual Auditor for Bias in CNN Image Classifier
@inproceedings{leeVisCUITVisualAuditor2022a,
  title = {{{VisCUIT}}: {{Visual}} Auditor for Bias in {{CNN}} Image Classifier},
  booktitle = {Proceedings of the {{IEEE}}/{{CVF}} Conference on Computer Vision and Pattern Recognition ({{CVPR}})},
  author = {Lee, Seongmin and Wang, Zijie J. and Hoffman, Judy and Chau, Duen Horng (Polo)},
  year = {2022},
  month = jun
}