VisGrader: Automatic Grading of D3 Visualizations


 Chau.webp)
Demo Video
Abstract
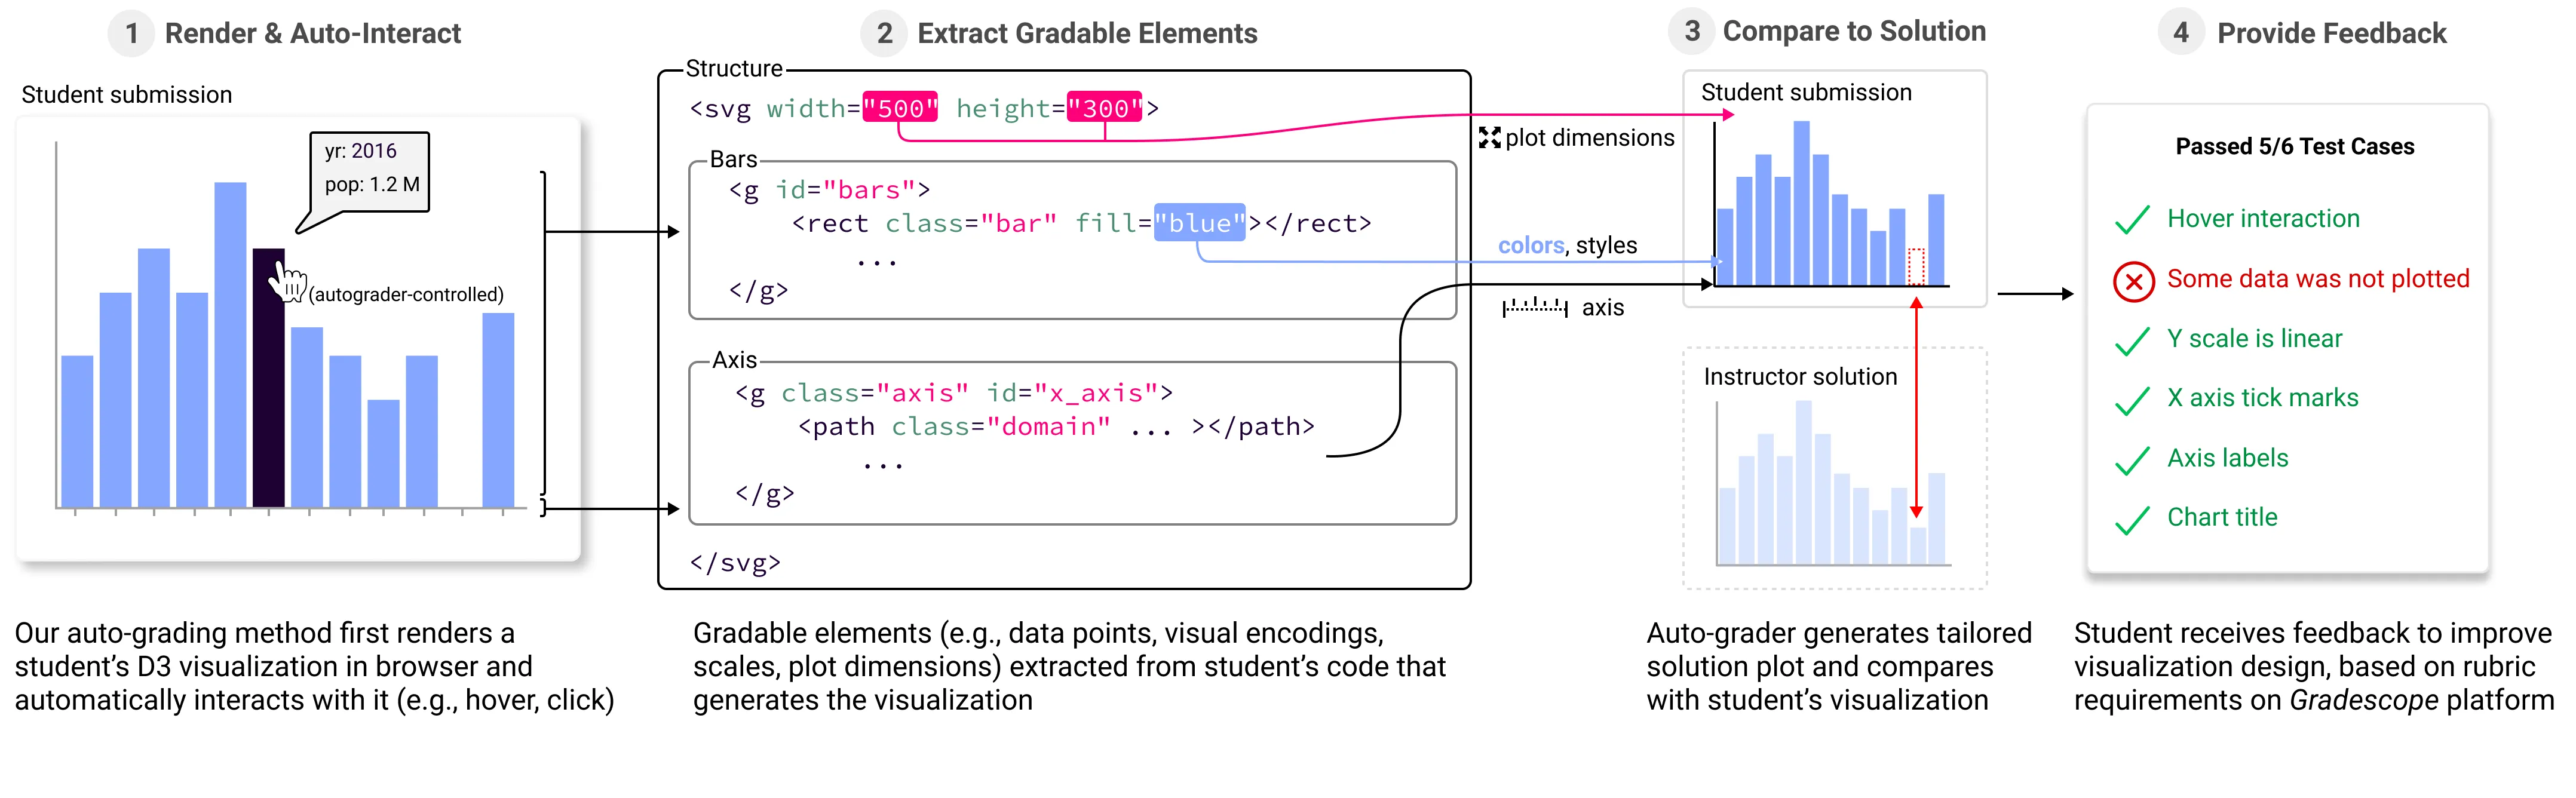
Manually grading D3 data visualizations is a challenging endeavor, and is especially difficult for large classes with hundreds of students. Grading an interactive visualization requires a combination of interactive, quantitative, and qualitative evaluation that are conventionally done manually and are difficult to scale up as the visualization complexity, data size, and number of students increase. We present VisGrader, a first-of-its kind automatic grading method for D3 visualizations that scalably and precisely evaluates the data bindings, visual encodings, interactions, and design specifications used in a visualization. Our method enhances students' learning experience, enabling them to submit their code frequently and receive rapid feedback to better inform iteration and improvement to their code and visualization design. We have successfully deployed our method and auto-graded D3 submissions from more than 4000 students in a visualization course at Georgia Tech, and received positive feedback for expanding its adoption.
Citation
VisGrader: Automatic Grading of D3 Visualizations
@article{hullVISGRADERAutomaticGrading2023,
  title = {{{VISGRADER}}: {{Automatic Grading}} of {{D3 Visualizations}}},
  shorttitle = {{{VISGRADER}}},
  author = {Hull, Matthew and Pednekar, Vivian and Murray, Hannah and Roy, Nimisha and Tung, Emmanuel and Routray, Susanta and Guerin, Connor and Chen, Justin and Wang, Zijie J. and Lee, Seongmin and Roozbahani, Mahdi and Chau, Duen Horng},
  year = {2023},
  journal = {IEEE Transactions on Visualization and Computer Graphics},
  doi = {10.1109/TVCG.2023.3327181},
  url = {https://ieeexplore.ieee.org/document/10297575/},
  urldate = {2023-11-21}
}