Visual Auditor: Interactive Visualization for Detection and Summarization of Model Biases


 Chau.webp)
Demo Video
Abstract
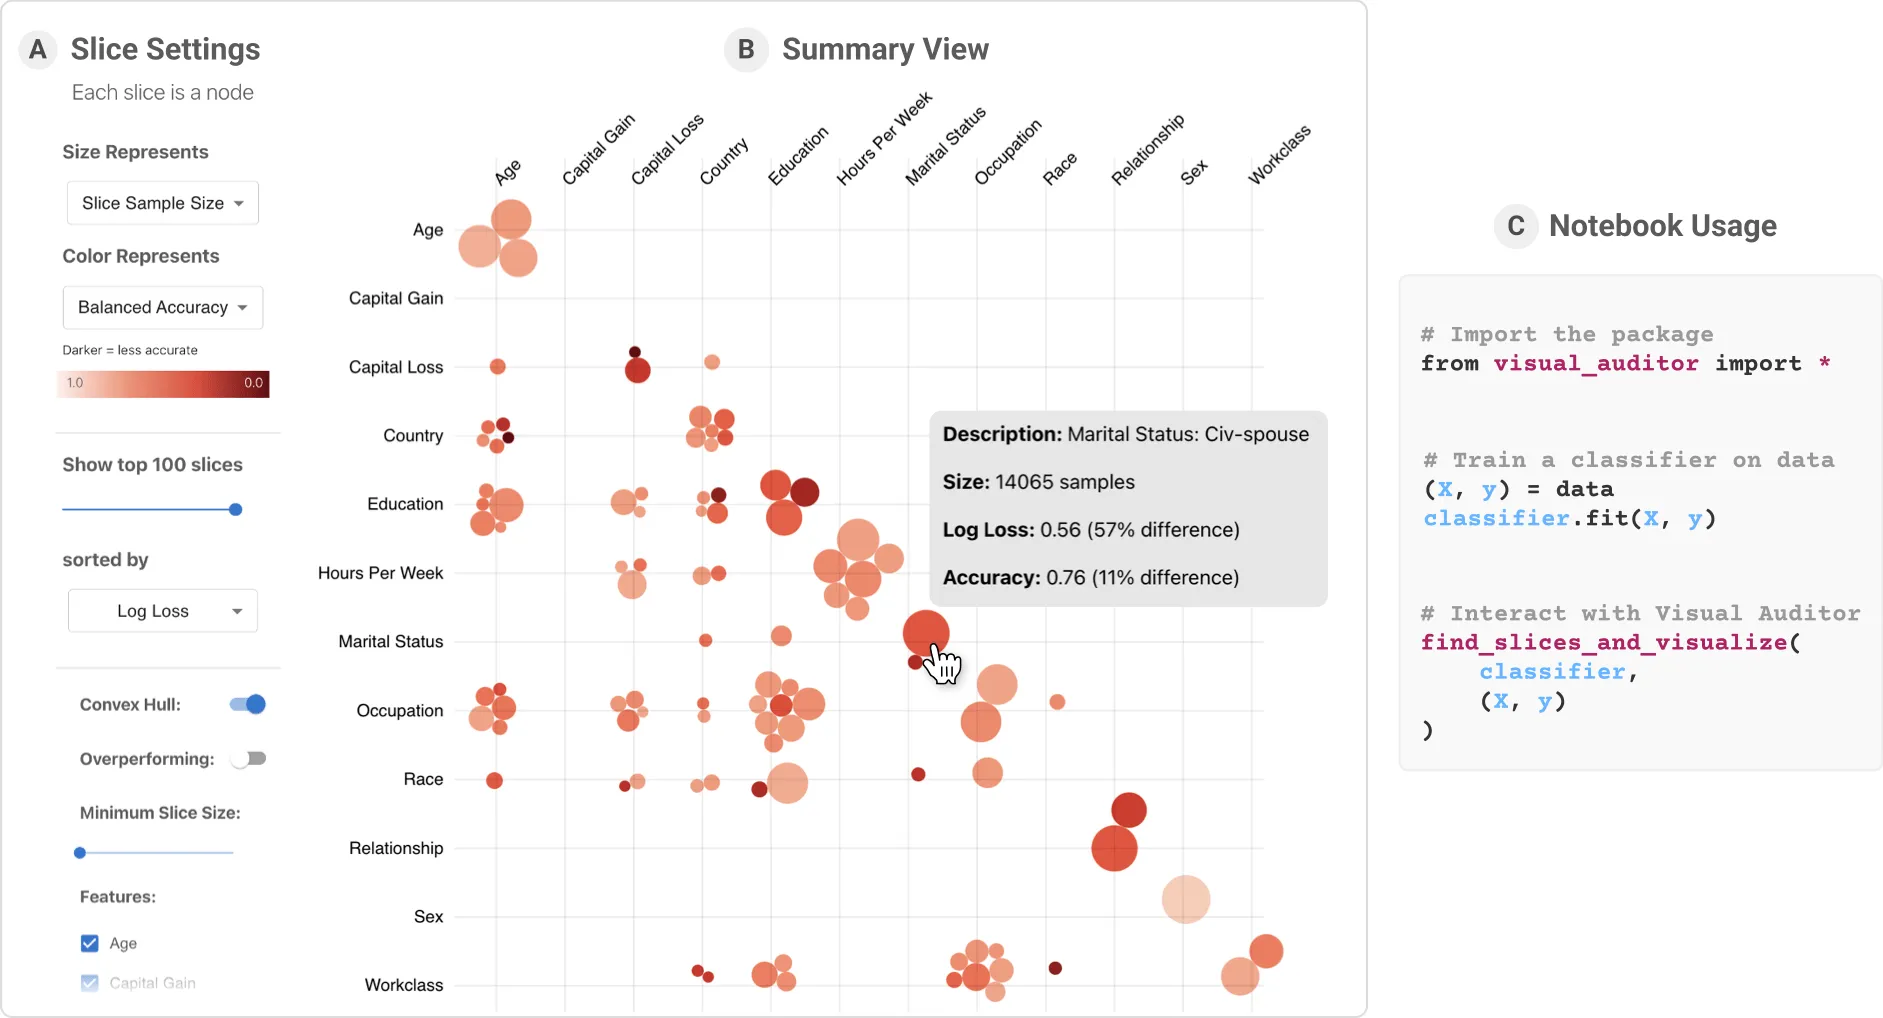
As machine learning (ML) systems become increasingly widespread, it is necessary to audit these systems for biases prior to their deployment. Recent research has developed algorithms for effectively identifying intersectional bias in the form of interpretable, underperforming subsets (or slices) of the data. However, these solutions and their insights are limited without a tool for visually understanding and interacting with the results of these algorithms. We propose VISUAL AUDITOR, an interactive visualization tool for auditing and summarizing model biases. VISUAL AUDITOR assists model validation by providing an interpretable overview of intersectional bias (bias that is present when examining populations defined by multiple features), details about relationships between problematic data slices, and a comparison between underperforming and overperforming data slices in a model. Our open-source tool runs directly in both computational notebooks and web browsers, making model auditing accessible and easily integrated into current ML development workflows. An observational user study in collaboration with domain experts at Fiddler AI highlights that our tool can help ML practitioners identify and understand model biases.
Citation
Visual Auditor: Interactive Visualization for Detection and Summarization of Model Biases
@inproceedings{munechikaVisualAuditorInteractive2022,
  title = {Visual {{Auditor}}: {{Interactive Visualization}} for {{Detection}} and {{Summarization}} of {{Model Biases}}},
  booktitle = {2022 {{IEEE Visualization Conference}} ({{VIS}})},
  author = {Munechika, David and Wang, Zijie J. and Reidy, Jack and Rubin, Josh and Gade, Krishna and Kenthapadi, Krishnaram and Chau, Duen Horng},
  year = {2022}
}